
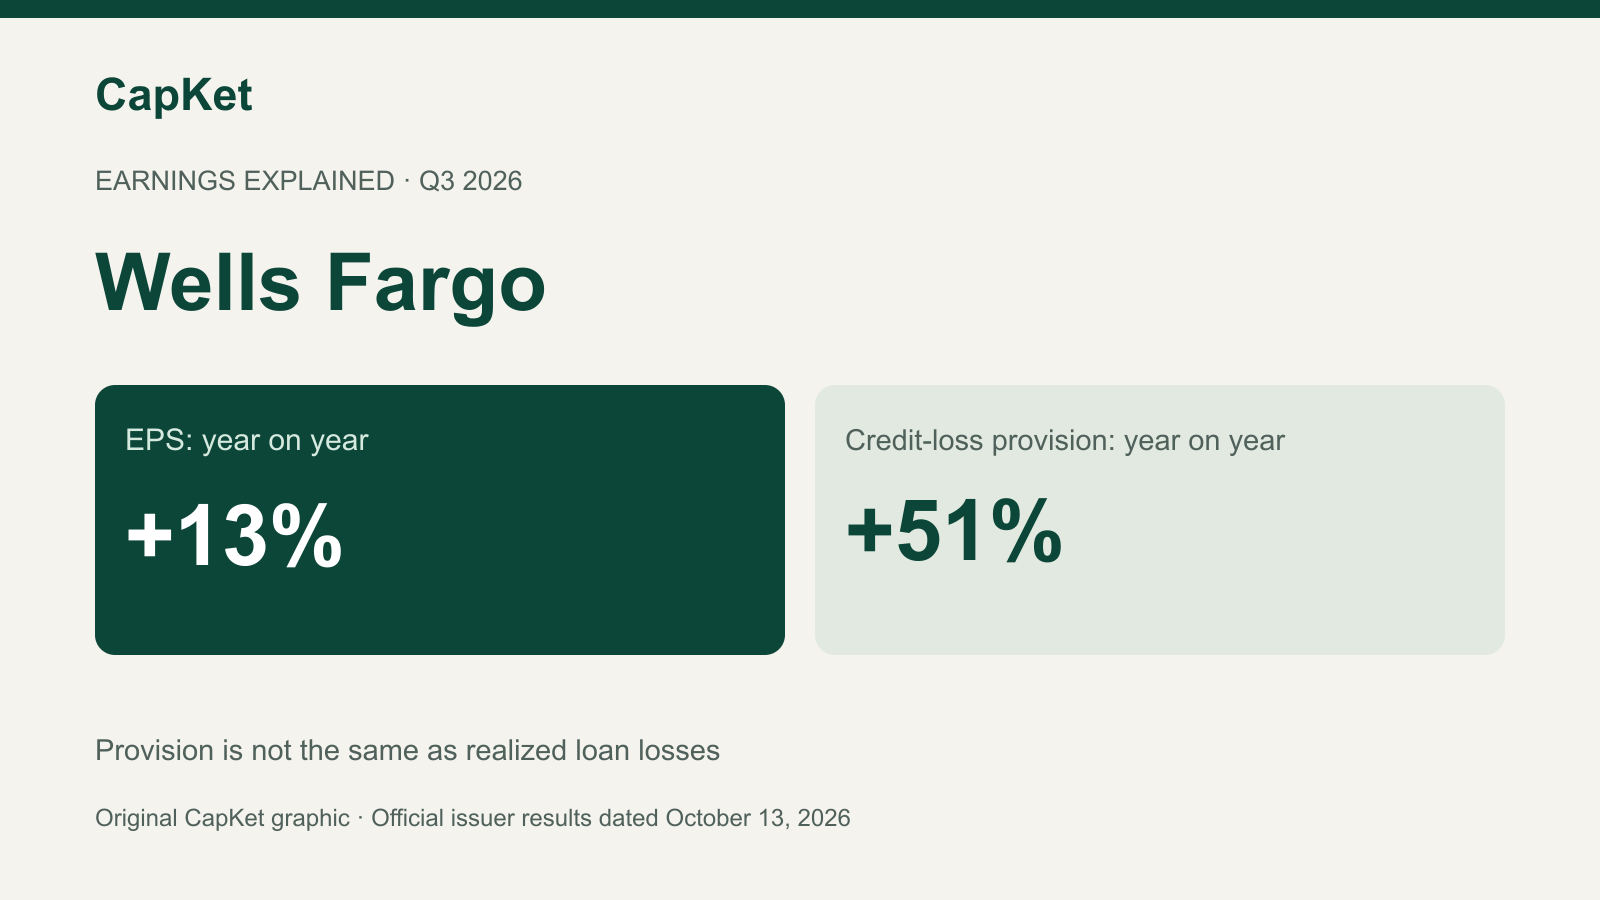
Wells Fargo reported third-quarter 2026 diluted earnings per share of $1.87, up 13% from $1.66 a year earlier, on October 13. Net income rose 6% to $5.951 billion. Alongside that earnings growth, the bank’s provision for credit losses increased 51% to $1.029 billion.
Earnings and credit figures
| Measure | Q3 2026 / comparison |
|---|---|
| Period | Quarter ended September 30, 2026 |
| Net income | $5.951 billion; Q3 2025: $5.589 billion |
| Reported diluted EPS | $1.87; Q3 2025: $1.66 |
| Total revenue | $21.870 billion; up 2% year on year |
| Provision for credit losses | $1.029 billion; Q3 2025: $681 million |
| Net charge-offs | $983 million; up 3% year on year |
| Average loans and deposits | Each up 11% year on year |
A provision is not the same as a charge-off
The provision is the income-statement expense for credit losses. Net charge-offs are loans written off after recoveries; they are a different measure. The third-quarter provision comprised $983 million of net charge-offs and a $46 million increase in the allowance for credit losses. It should not be described as $1.029 billion of new defaults.
The issuer said the allowance increase reflected higher commercial and industrial loan and auto-loan allowances driven by higher loan balances, partly offset by a lower commercial real estate allowance. This is the bank’s explanation; CapKet has not independently assessed every loan portfolio.
What the earnings increase does—and does not—show
Total revenue increased 2% from the year-earlier quarter, while net income increased 6% and EPS increased 13%. Those are three different measures. EPS is income attributable per diluted common share, not total bank profit; its percentage movement need not match net income growth.
Wells Fargo also reported $2.5 billion of common-share repurchases during the quarter. That is historical capital returned through buybacks, not a promised investment return. This report uses the stated results without inventing an adjusted EPS or a market-price reaction.
The release explicitly calls the results preliminary. Final results and disclosures will be in the quarterly Form 10-Q and may differ. Readers should watch that filing and credit tables, not treat one quarter’s earnings growth as proof that credit risk has disappeared.
Read CapKet’s separate HCLTech earnings report. It concerns a different company and reporting period, not a like-for-like banking comparison.
Official sources and checks
Source observation: 13/10/2026, 20:22:52 IST. Official results document · Issuer supporting page or document.
Recorded source observation: . This is a source-check timestamp, not a market quote or a new article update.