
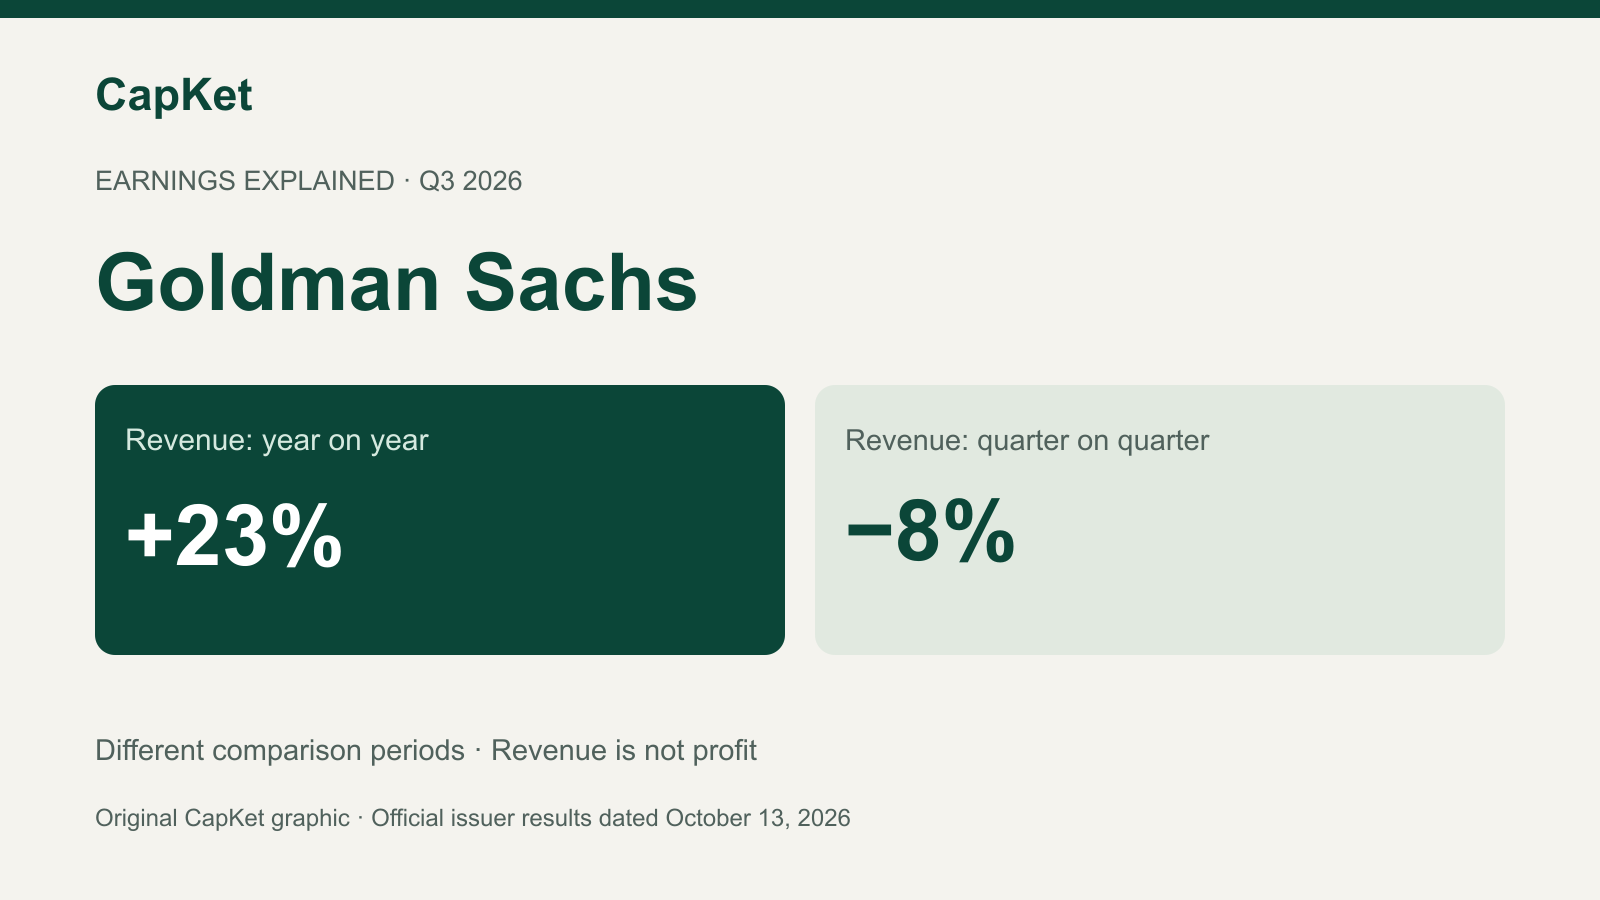
Goldman Sachs reported third-quarter 2026 net revenues of $18.68 billion and net earnings of $5.29 billion on October 13. Revenue was 23% higher than in the same quarter of 2025, but 8% lower than in the second quarter of 2026. That difference matters: a strong annual comparison does not mean every sequential measure improved.
The quarter in figures
| Measure | Q3 2026 / comparison |
|---|---|
| Period | Quarter ended September 30, 2026 |
| Net revenues | $18.68 billion; up 23% year on year, down 8% quarter on quarter |
| Net earnings | $5.29 billion |
| Diluted EPS | $17.01; Q3 2025: $12.25; Q2 2026: $20.98 |
| Investment banking fees | $3.22 billion; up 21% year on year |
| Equities net revenues | $6.44 billion; up 72% year on year |
Where the revenue growth appeared
The firm reported Global Banking & Markets net revenues of $13.46 billion, 32% above the year-earlier quarter. Investment banking fees rose 21%. Underwriting is a service that helps issuers bring securities to investors. Goldman attributed that fee increase primarily to advisory activity involving completed mergers and acquisitions and higher equity underwriting revenues, including initial public offerings and secondary offerings.
Equities net revenues rose 72% to $6.44 billion. These revenues relate to Goldman’s financing and intermediation businesses; they do not mean equity prices or an investor’s portfolio increased 72%. The issuer’s explanations are company-reported, not an independent CapKet assessment of market drivers.
Revenue, earnings and comparisons are different
Net revenue is not net profit. The $18.68 billion revenue figure and $5.29 billion earnings figure describe different parts of the income statement and must not be added together. Diluted EPS expresses earnings per common share after allowing for applicable potential dilution.
The $17.01 quarterly EPS is above the $12.25 reported a year earlier and below the preceding quarter’s $20.98. It should not be confused with the $55.56 EPS reported for the first nine months of 2026. This article uses the reported quarterly figures; it does not invent an adjusted EPS or an analyst-consensus comparison.
For the next check, examine the full segment tables and subsequent filing. A higher fee total does not guarantee that future transactions will close or that the next quarter will repeat these results. No share-price reaction or investment return is established here.
Read CapKet’s separate HCLTech earnings report. It concerns a different company and reporting period, not a like-for-like banking comparison.
Official sources and checks
Source observation: 13/10/2026, 20:22:52 IST. Official results document · Issuer supporting page or document.
Recorded source observation: . This is a source-check timestamp, not a market quote or a new article update.