
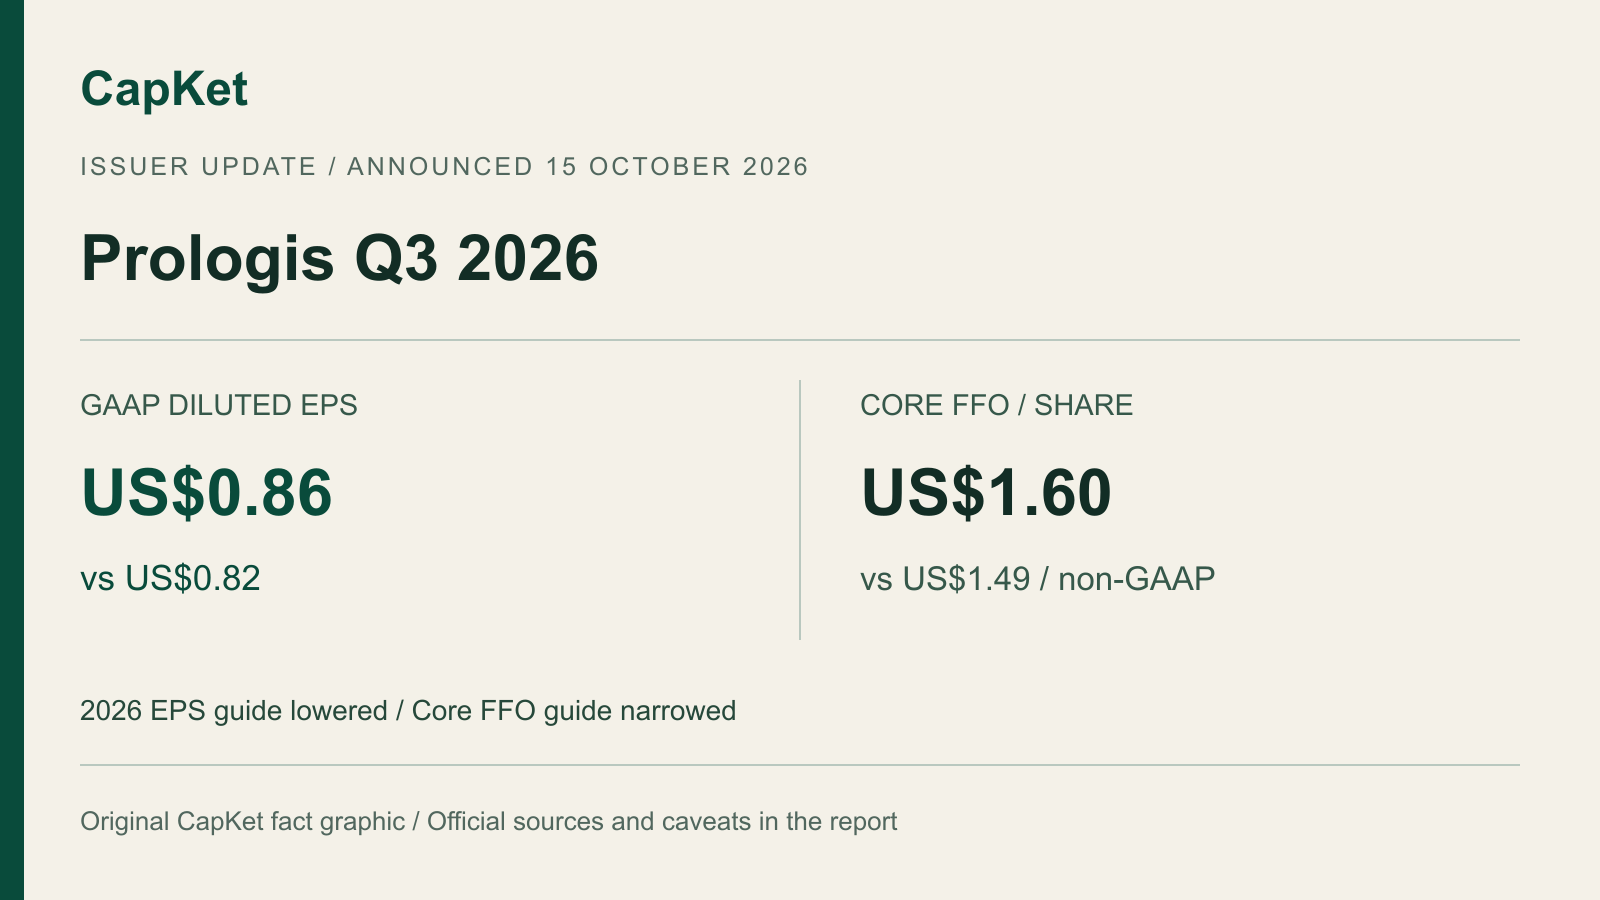
Prologis reported higher third-quarter earnings but reduced its full-year GAAP profit forecast, making the guidance distinction central to its October 15, 2026 results. For the quarter ended September 30, net earnings per diluted share were $0.86, against $0.82 a year earlier. Core funds from operations, or Core FFO, were $1.60 per diluted share, compared with $1.49. Core FFO is a non-GAAP measure, not another name for net profit.
Prologis Q3 2026: results and guidance
| Measure | Reported figure |
|---|---|
| Total revenue, rounded issuer table | US$2,388 million vs US$2,214 million |
| Quarterly diluted GAAP EPS | US$0.86 vs US$0.82 |
| Quarterly Core FFO per diluted share, non-GAAP | US$1.60 vs US$1.49 |
| 2026 GAAP EPS guidance: previous → current | US$4.40–4.55 → US$4.05–4.15 |
| 2026 Core FFO guidance per share: previous → current | US$6.22–6.30 → US$6.25–6.29 |
Why “outlook raised” would be misleading
The annual net-earnings range moved down at both ends. By contrast, the Core FFO range became narrower: its lower bound increased and its upper bound decreased. These are different measures, so the changes cannot be collapsed into one unqualified claim that profit guidance improved. The forecast is management’s expectation for 2026, not earnings already generated.
What Core FFO does and does not show
Funds from operations is a supplemental measure used in real estate. Prologis adjusts GAAP earnings for items including real-estate depreciation and certain gains or losses, with further adjustments to arrive at its Core FFO definition. The release provides reconciliations. The measure is not a substitute for GAAP earnings, operating cash flow, a dividend or an investor’s return. Readers comparing property companies also need to check whether their definitions match.
Prologis says its earnings guidance includes potential gains from real-estate transactions but excludes future foreign-exchange or derivative gains and losses under its constant-currency assumptions. Those qualifications matter when comparing the annual ranges. This report does not assign an unverified cause to the guidance change, claim a consensus beat or report a share-price move. The release and investor page are issuer materials, not two independent assessments.
Related: separating revenue, profit and operating measures in Wipro’s results.
Official sources and verification
Sources observed: 16/10/2026, 02:33:15 IST. Issuer announcement and financial tables · Issuer investor page / announcement index
Recorded source observation: . This is a source-check timestamp, not a market quote or a new article update.