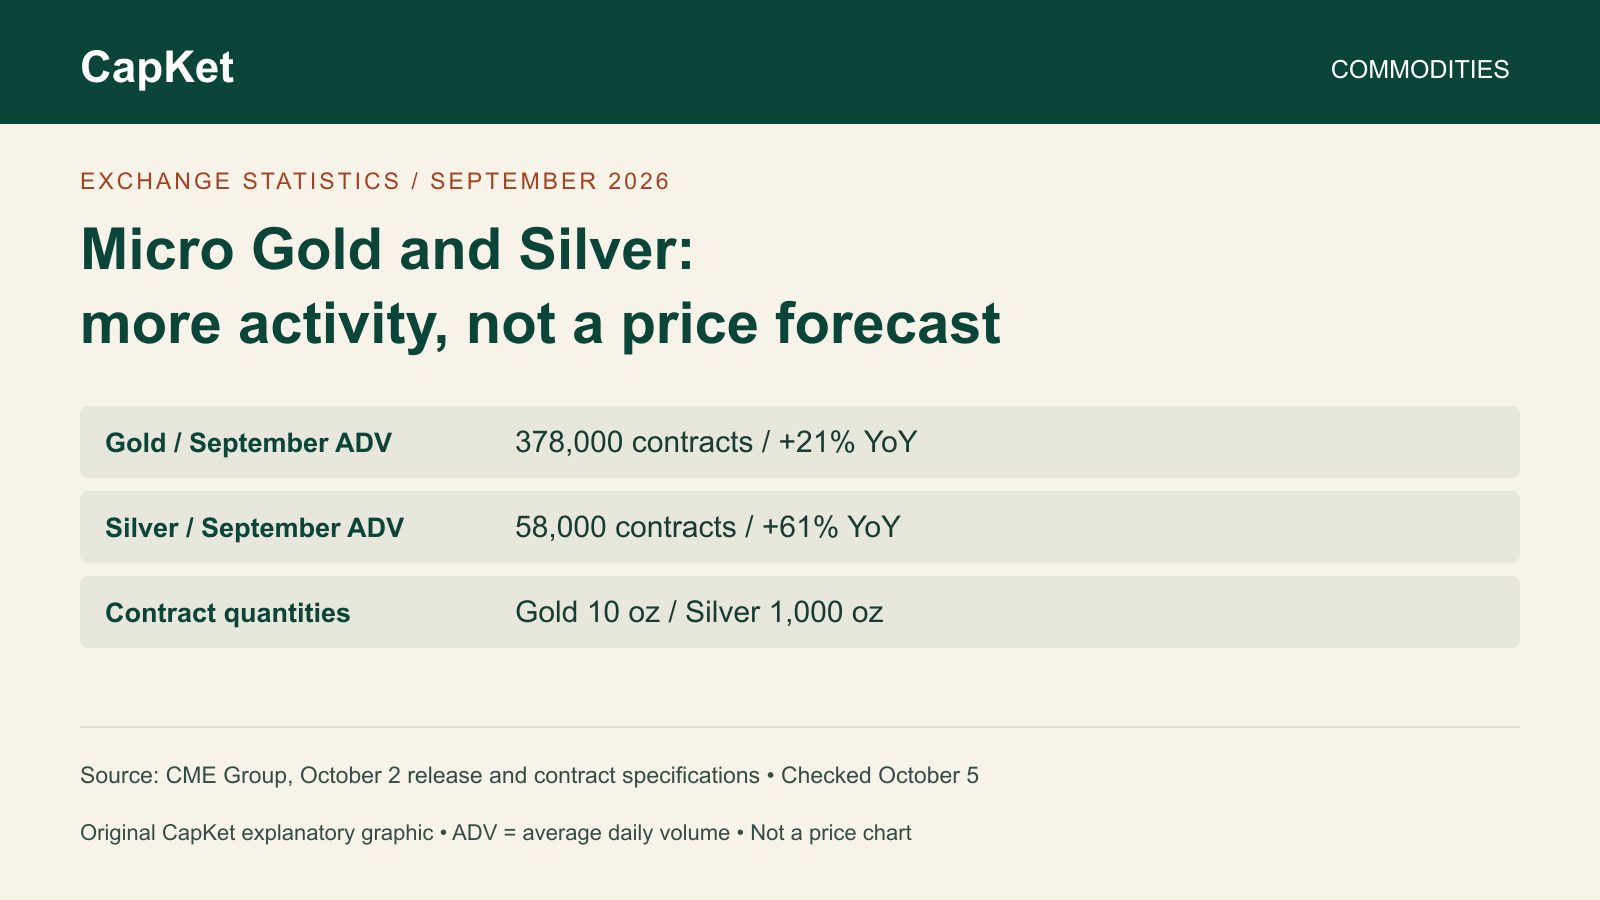
Micro Gold and Silver futures attracted more trading activity in September, according to CME Group’s October 2 statistical release. Average daily volume reached 378,000 contracts for Micro Gold, up 21% year on year, and 58,000 for Micro Silver, up 61%. Those figures describe turnover, not today’s metal prices.
How to read the activity numbers
CapKet explanation: More contracts changing hands cannot, by itself, establish that buyers became more optimistic. A volume figure should not be presented as a gold or silver price forecast. This report has not verified a reason for the increase, trader positioning or a current settlement.
Micro Gold vs Micro Silver: what does one contract represent?
| Comparison | Micro Gold (MGC) | Micro Silver (SIL) | Primary evidence |
|---|---|---|---|
| September 2026 average daily volume | 378,000 contracts; +21% year on year | 58,000 contracts; +61% year on year | October 2 statistical release |
| Quantity per contract | 10 troy ounces | 1,000 troy ounces | CME contract specifications |
| Settlement | Physical delivery | Physical delivery | CME settlement fields |
| Illustrative $1-per-ounce move | $10 per contract | $1,000 per contract | CapKet calculation: contract quantity × $1; not an observed price move |
The same word “micro” covers different quantities. Compare contract exposure and delivery requirements, not just the number of contracts traded. The volume totals do not supply a particular expiry’s price or executable liquidity.
The dollar-movement examples exclude fees. Position direction determines whether a price move produces a gain or a loss; these examples are not market quotations or forecasts.
What to check before comparing exposures
Start with the actual product code and contract month rather than a generic gold or silver headline. Ask how much exposure one contract represents, which delivery dates apply and what margin your broker requires. A smaller contract can still create losses that are large relative to the funds initially committed.
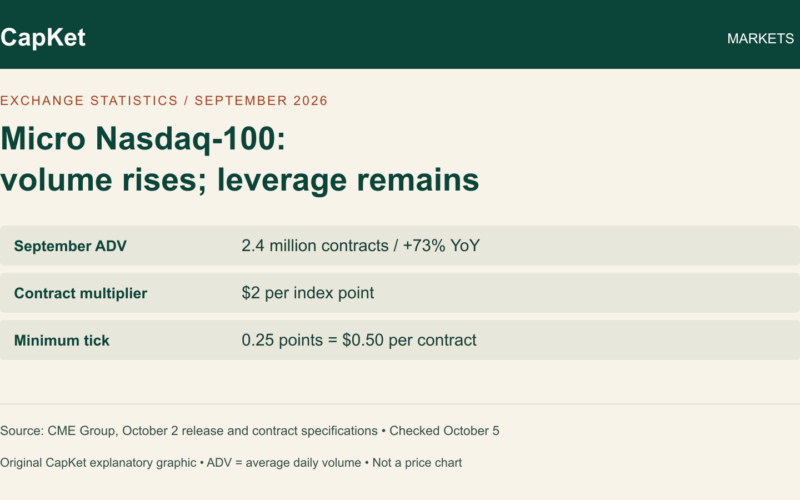
For the equity side of smaller-sized derivatives, see our Micro Nasdaq-100 volume and contract-risk explainer. These reports examine different underlying markets; neither reports a live price.
Primary evidence: CME’s October 2 September statistics and official Micro Metals specifications, observed October 5, 2026 at 12:34 IST. Exchange-reported figures have not been independently audited by CapKet.
Reader clarification — 19 October 2026: Added a side-by-side contract comparison and linked each factual row to CME. September turnover is still not a current metal price. The original publication date is retained. Source recheck: (UTC); AI-assisted document review, not independent human approval.
Recorded source observation: . This is a source-check timestamp, not a market quote or a new article update.