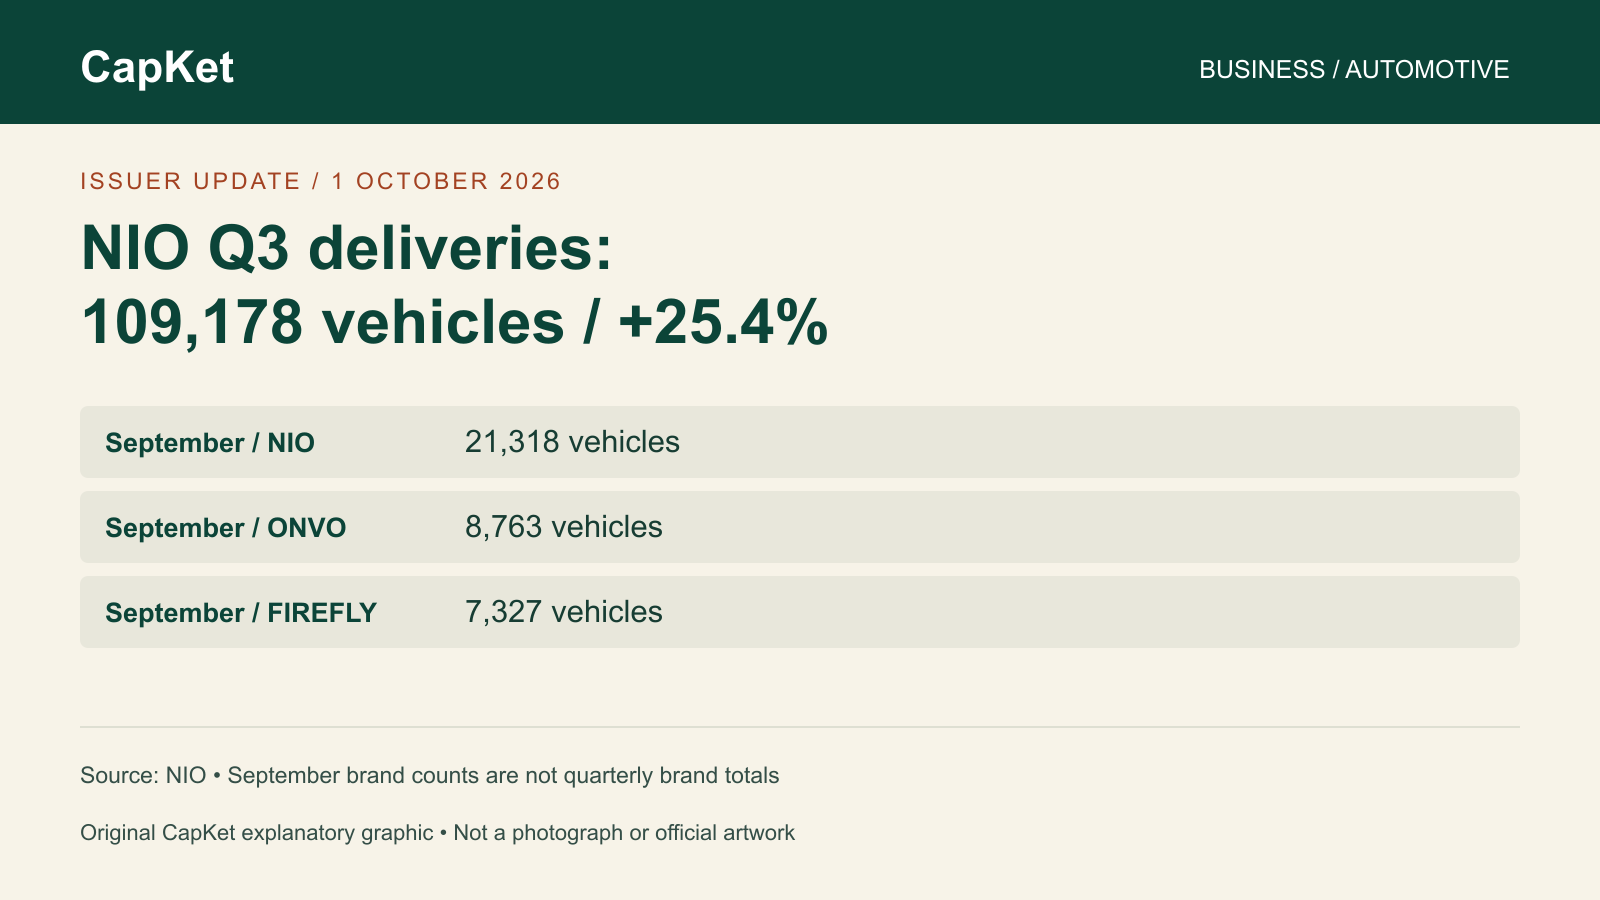
NIO Q3 deliveries reached 109,178 vehicles, a 25.4% increase from the same quarter a year earlier, the company reported on October 1. Its September total was 37,408 vehicles, up 7.7% year on year. The brand breakdown helps explain what is inside the monthly group number.
NIO Q3 deliveries and September are different measures
The quarterly figure covers three months; the September figure covers one. Their growth percentages use different comparison periods. Reading 25.4% beside 7.7% does not establish a month-on-month fall or a cause for the difference.
How the September brand totals add up
| Brand | Vehicles delivered | Share of September total |
|---|---|---|
| NIO | 21,318 | 57.0% |
| ONVO | 8,763 | 23.4% |
| FIREFLY | 7,327 | 19.6% |
| Total | 37,408 | 100.0% |
CapKet calculation: Each share is the brand’s September deliveries divided by 37,408, rounded to one decimal place. The three vehicle counts sum to the reported monthly total. These are September shares, not quarterly brand shares.
What unit share cannot tell investors
CapKet analysis: A brand providing about 57% of vehicles is not necessarily providing the same share of revenue or profit. Unit counts alone leave selling prices, costs and the economics of the product mix unresolved. The delivery release should not be treated as a complete earnings statement.
CapKet has not verified comparable earlier monthly brand totals, analyst expectations or a share-price reaction. This report therefore makes no claim about accelerating brand demand, a forecast beat or a trading opportunity. The next useful evidence is a comparable operating series and the company’s financial disclosures.
For a related reporting distinction, read our Tesla Q3 operating update and earnings-date explainer.
Primary source: NIO’s October 1 delivery release, observed October 5, 2026 at 07:59 IST. The numbers are issuer-reported, not independently audited by CapKet.