
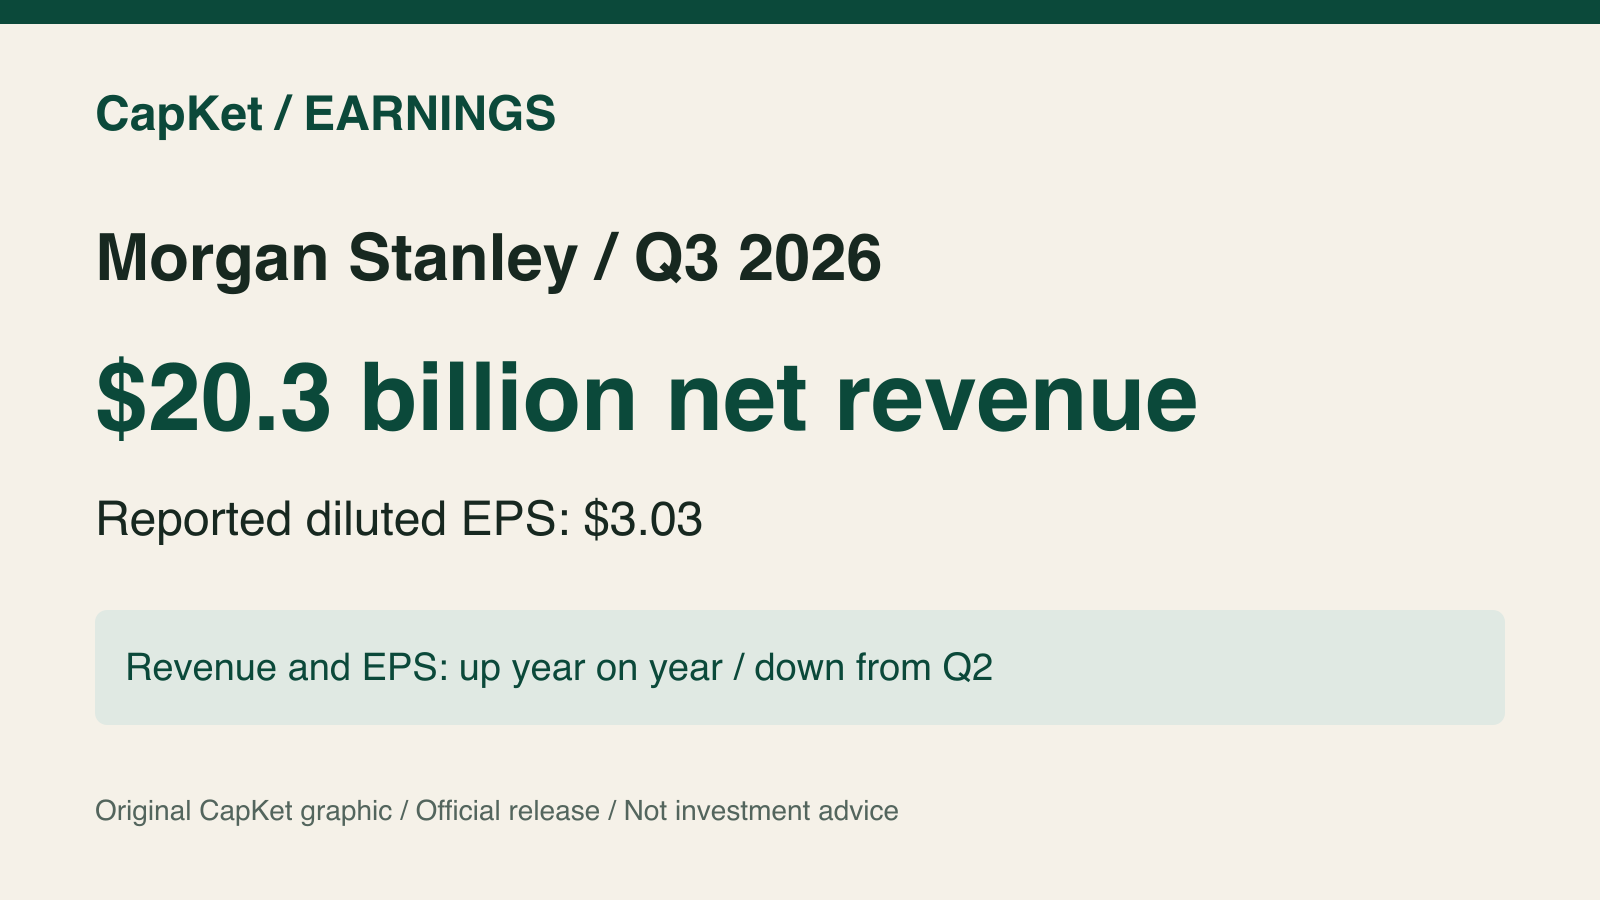
Morgan Stanley’s October 14, 2026 release reported net revenue of $20.338 billion and diluted earnings per share of $3.03 for the quarter ended September 30. Revenue and EPS were higher than a year earlier but lower than in the June quarter. Reading both comparisons is more informative than treating the results as an uninterrupted acceleration or a share-price prediction.
Reported figures: two comparisons
| Measure | Q3 2026 | Q2 2026 | Q3 2025 |
|---|---|---|---|
| Net revenue, US$ billion | 20.338 | 21.348 | 18.224 |
| Net income applicable to Morgan Stanley, US$ billion | 4.909 | 5.581 | 4.610 |
| Diluted EPS, US$ per share | 3.03 | 3.46 | 2.80 |
| Return on average common equity | 17.8% | 20.7% | 18.0% |
The statements are unaudited. The company reports revenue growth of 12% year on year, rounded, alongside a 5% sequential decline. Net income applicable to Morgan Stanley is not the same as earnings attributable to common shareholders: preferred dividends are deducted in the common-share earnings calculation. The EPS above is reported diluted EPS, not a separately adjusted EPS figure.
Trading and wealth management were not uniform
Equity net revenue increased to $5.799 billion from $4.116 billion a year earlier. Fixed-income net revenue fell to $2.011 billion from $2.169 billion. Wealth Management net revenue was $9.065 billion, while Investment Management net revenue fell to $1.459 billion from $1.651 billion. Segment totals cannot simply be added to reproduce the firm total because the supplement includes intersegment eliminations.
Wealth Management recorded $232.4 billion of net new assets. The issuer says just over half was associated with IPO-related flows. Those client-asset inflows are not quarterly revenue, profit or necessarily a recurring inflow of the same size. They should not be added to the revenue figures.
What the 22.6% return means
Return on tangible common equity, or ROTCE, was 22.6%, compared with 26.6% in Q2 and 23.5% a year earlier. Morgan Stanley identifies this as a non-GAAP measure. It uses annualized income after preferred dividends relative to average common equity adjusted for goodwill and certain intangible assets. It is different from the 17.8% reported return on common equity and is neither an adjusted EPS nor a net-profit margin.
The supplement also explains a change in deferred-compensation hedging from Q1 2026. The firm no longer presents the earlier DCP-excluding non-GAAP revenue measures. This report compares the stated reported revenues, including $18.224 billion for Q3 2025, rather than mixing that basis with the earlier adjusted series.
Dividend and next checks
The board declared a quarterly dividend of $1.15 per common share, payable November 13 to shareholders of record on October 30, 2026. The release’s capital ratios are estimates subject to change in the later Form 10-Q. CapKet has not verified an ex-dividend date, an analyst-consensus beat or a stock-market reaction. Related report: ASML’s reported Q3 results versus its future outlook.
Official documents and checks
Source observation: 14/10/2026, 17:08:36 IST. Q3 earnings release · Financial supplement and measure definitions.
Recorded source observation: . This is a source-check timestamp, not a market quote or a new article update.